
There are many open source applications and software available for spatial analysis and visualisation of spatial data. Here are some options and guides, as an alternative from ArcGIS.
|
QGIS (Unix, Linux, Windows, Mac OS)
|
R/Rstudio (Unix, Windows, Mac OS) |
Tableau (Windows, MacOS)
|

Visit the the NUS and Yale-NUS Library Libguides for compilations of global, regional, and local data, statistics and spatial data sources (see first and second links below).
1. Frame Your Question
Before you deep-dive into your analysis, you need to scope out your project. Identify your objectives and problem statement. What is it that you want to find out or achieve? Ask relevant spatial questions that you want to further investigate, for example:
- Where should new police stations be located at?
- Where are the clusters of dengue outbreak? Why are there clusters?
- How much cropland is there in each watershed? What are the land use changes across the years?
This will help you decide how to approach the analysis and which GIS tools and method to use for the analysis.
2. Choose, Explore and Prepare Your Data
This step can be the most time-consuming, but it is a crucial part of the project. What are the information you need to carry out your project? Are there spatial components in your problem statement? To help you identify the data you require, think about the following 3 Ws:
What? Topic and format.
Where? Extent or spatial scale - is your study related to a city, country or global?
When? Temporal scale - is your study looking at past, present or future conditions?
Some data sources have been compiled here.
Once you have obtained your data, explore and check if the data is in a usable format (i.e. Is it readable in your analysis programme like ArcGIS or R? Has it been cleaned?). A clean dataset is often underrated. Organize your data into a project folder or file-geodatabase (in ArcMap) to simplify analysis tasks and facilitate sharing your work with others.
3. Design Your Analysis Method, Perform the Analysis
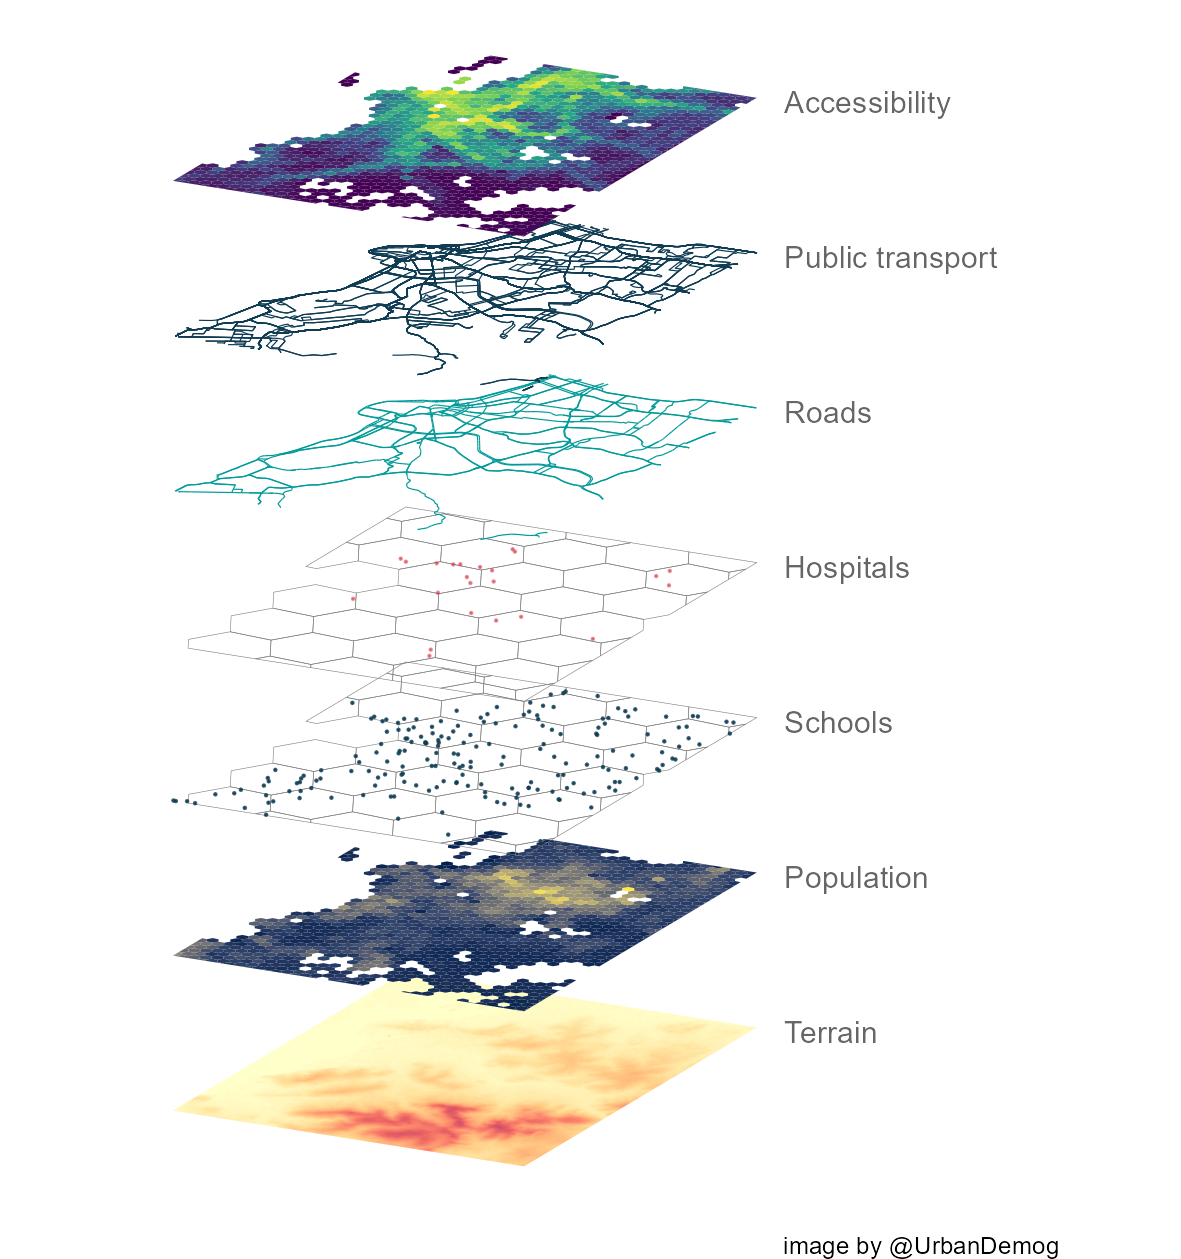
Process the data analytically to draw out essential information that helps you answer your problem statement. Begin by identifying the appropriate analytical operations you need to perform (i.e. Creation of new geospatial information? Spatial statistics? Raster or image analysis?). Consider the questions framed in Step 1 and the data you have at hand. There are four broad groups of spatial analysis techniques: Overlay, Proximity, Temporal and Statistical. Visit the ESRI geoprocessing tools website for more ideas of what tools are available in ArcGIS.
Hint: Design a flow chart of the sequence of your operation for your analysis.
Display the results graphically and manipulate them to reveal something interesting or useful. Create alternative scenarios by changing your methods or parameters and re-run the analysis again.
4. Examine your Results
Take a look at your results and seek explanations for the patterns you see on the map. Compare between maps and speculate the processes through which the patterns are associated over space and time. There may be instances where you need to perform multiple analysis runs to achieve the different results for comparisons. This is especially when assumptions about the data, analysis methods or mapping methods would alter results. It is an iterative process.
Assess whether your results could provide adequate answer to the question or problem statement you have asked in Step 1. Are there areas where you could dive deeper to examine and develop a viable and useful picture of the environment? For example, you have just discovered dengue hotspots in certain areas, and would like to examine what are the underlying factors that give rise to dengue outbreak clusters?
In some cases, you can take action or provide recommendations based on your results. In some cases, no action is required as your goal was to gain a deeper understanding of the issue.
5. Share your Findings
 Communicate your results and recommendations. Bear in mind your audience. This will help you determine an ideal method of disseminating information efficiently and effectively.
More often than not, the output of a GIS analysis would be a map (but you could use other infographics, charts, graphs, etc). An effective map should present you key message and findings. It should read independently from the wider presentation of the project. Some questions to ask yourself:
- Is the symbology format and colour scheme appropriate?
- Is my map too cluttered? HAve I included too much information?
- Can my reader extract the important information quickly?
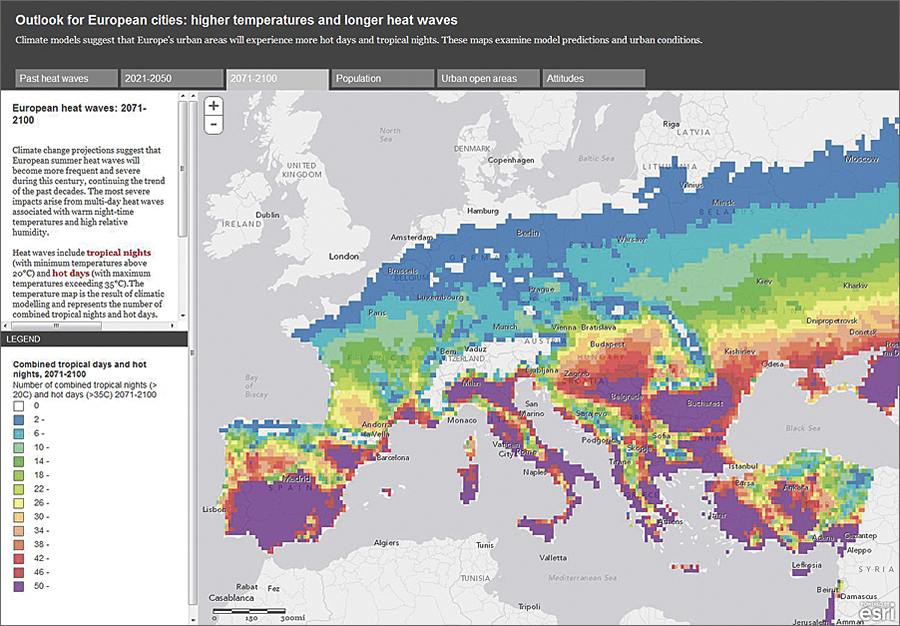
One way to share your findings is through interactive story maps, for example: ESRI Story Maps. Just do a quick Google into the other interesting methods through which people share their findings, quick examples: Noise, Eruptions, Earthquakes and Emissions, Amsterdam!
Adapted from: ESRI Training Matters, 2009. Use the Five-Step GIS Analysis Process
ESRI Learn ArcGIS, 2015. Spatial Problem Solving Approach